Age Stratified All-Cause and COVID-19 Associated Mortality
Abstract:
We consider the age stratified all-cause and COVID-19 associated mortality in Germany during 2020 based on numbers provided by the Federal Statistical Office and the Robert Koch Institute.
Update 2021-03-01: An up-to-date and methodologocial improved version of the post, including population adjusted excess mortality calculations for 2020 based on the most recent Destatis and RKI data is available here.

 This work is licensed under a Creative Commons
Attribution-ShareAlike 4.0 International License. The
markdown+Rknitr source code of this blog is available under a GNU General Public
License (GPL v3) license from github.
This work is licensed under a Creative Commons
Attribution-ShareAlike 4.0 International License. The
markdown+Rknitr source code of this blog is available under a GNU General Public
License (GPL v3) license from github.
Introduction
All-cause mortality is one of indicators used to measure the impact of the COVID-19 pandemic, because this indicator is less biased by the testing strategy needed to identify cases to have died while having a recent COVID-19 diagnosis. Since both death and COVID-19 have a strong age component, it appears crucial to take an age-stratified view on both all-cause mortality as well as deaths associated with COVID-19. This will also help to put age-related COVID-19 mortality in a bigger picture.
Age Stratified Mortality
Real-time mortality monitoring is not common in Germany, as can be seen from the coverage of the EuroMoMo monitoring for Germany, where only the two federal states Hesse and Berlin participate. However, as part of the COVID-19 response, the Federal Statistical Office (Destatis) now provides weekly updated preliminary mortality statistics of all-cause mortality in 2020. The methodology behind the numbers as well as age-stratified additional analyses are described in an accompanying publication (zur Nieden, Sommer, and Lüken 2020). The age-stratified analyses are unfortunately not continuously updated, however, up-to-date data are made publicly available.

The reported COVID-19 associated deaths (by week of death) are obtained from an export of the RKI. However, the COVID-19 deaths are not available in age-stratified form. Furthermore, in order to compensate for reporting delays of deaths, the Destatis analysis only goes until 4 weeks before the time point of analysis, i.e. the 2020-12-18 version shown in the above image only reaches ISO week 47 (spanning the time period 2020-11-16 - 2020-11-22).
The aim of the present blog post is to provide an up-to-date age-stratified view including COVID-19 associated deaths. As additional data source we use the age-stratified cumulative number of deaths reported every Tuesday in the RKI situational report (p.7).
Data I/O
This section consists of data wrangling the above mentioned data sources. One challenge is for example to align the age classes used in the different sources. See the R code on GitHub for the gory details.
Up-to-date age-stratified all-cause mortality
Available all-cause deaths (by week of death) are available until 2020-W47. Note that Destatis stresses the preliminary character of the data - the numbers might change as further deaths arrive. Stratified by age the times series for 2020 compared to the years 2016-2019 looks as follows - please beware of the different y-axes for the age-groups in the plot:

Since the age-groups also contain different population sizes, a better comparison between age-groups instead of absolute numbers is by incidence rate (i.e. deaths per 100,000 population in the age group). To underline the age-gradient of mortality: 56% of the deaths 2016-2019 occured in the age group of 80+ years (90% in the age group of 60+). It becomes clear that 2020 mortality in the 80+ age groups was rather low during the first 10-12 weeks and then had a spike in connection with the first COVID-19 wave (March-April). Subsequently, a summer peak (possibly associated with heat) is followed by an increasing and ongoing upward trend. One challenge for a statistical analysis of these numbers is to figure out how much of the upwards trend is “catch-up mortality” due to the lower mortality in the beginning of the year and how much is excess related to COVID-19.
An initial analysis of this question consists of summing the all-cause mortalities from W1 until W47 for 2020 (observed) and compare this to the summation of the weekly mean of 2016-2019 for the corresponding time period (expected)1. When we do this by age-group we obtain:
| Age group | observed | expected_20162019 | Percent change | min_20162019 | max_20162019 |
|---|---|---|---|---|---|
| [00,30) | 6533 | 7057 | -7% | 6802 | 7346 |
| [30,40) | 6053 | 5829 | 4% | 5755 | 5869 |
| [40,50) | 13976 | 15348 | -9% | 14093 | 16766 |
| [50,60) | 51060 | 52527 | -3% | 51445 | 53455 |
| [60,70) | 104426 | 100734 | 4% | 96860 | 104023 |
| [70,80) | 176047 | 190420 | -8% | 182443 | 193917 |
| [80,90) | 325530 | 306112 | 6% | 290587 | 315843 |
| [90,Inf) | 171684 | 160108 | 7% | 147177 | 167511 |
| Total | |||||
| Total | 855309 | 838136 | 2% | 811365 | 860975 |
| a Min and max for row ‘Total’ is obtained by first summing each of the years 2016-2019 and then take the min and max. | |||||
So in these numbers the mild mortality in the older age groups during the first weeks balances some, but not all, of the excess in these age-groups since Mar-Apr. The total proportion of 2020-W1 to 2020-W47 mortalities in the 80+ age group is currently 58%. However, it is also important to realize that the current observed 2020 numbers contain the consequences of all type of effects from the pandemic management, which includes changes in the population behavior due to interventions. Disentangling the complex effects of all-cause mortality and the COVID-19 pandemic is a delicate matter, which takes experts in several disciplines (demographers, statisticians, epidemiologists) to solve. However, should you based on the above numbers happen to think that COVID-19 is not a serious problem, it is insightful to think about the prevention paradox and take a look at the all-cause mortality statistics from other countries.
All-Cause Mortality and COVID-19 Associated Deaths
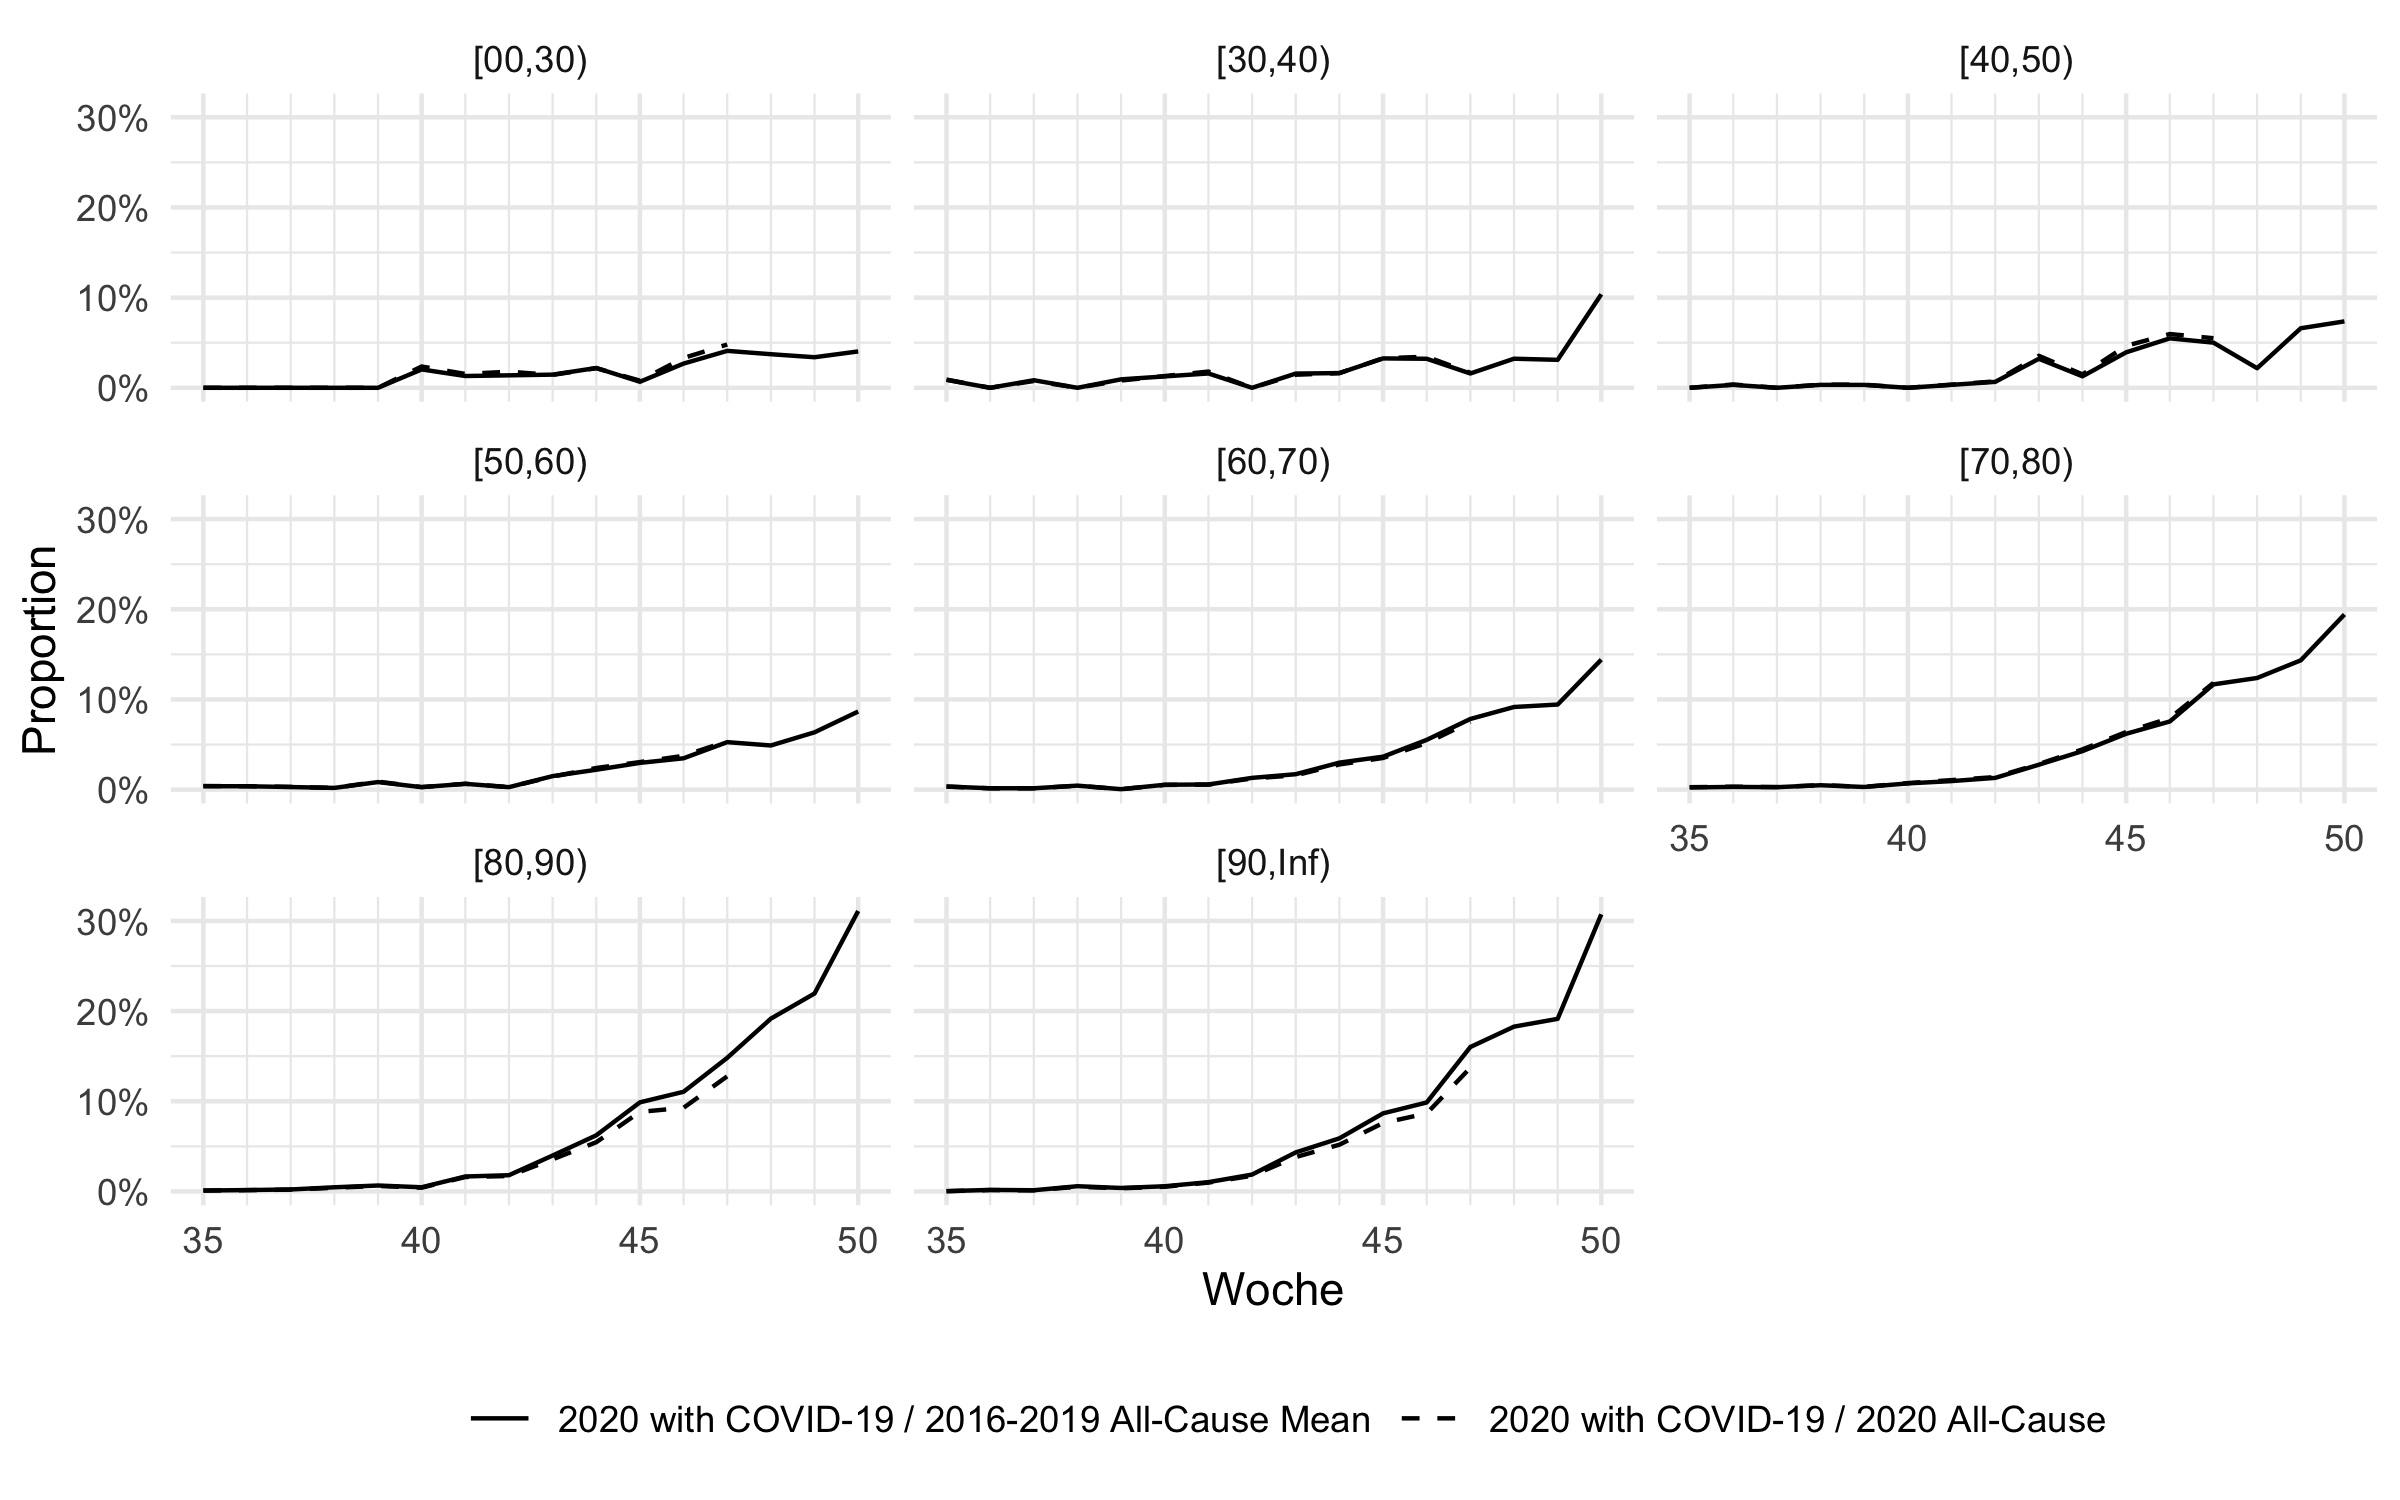
To see, how much of the all-cause mortality is directly contributed by deaths in association with COVID-19, we match the age-stratified all-cause mortality data with the age-stratified COVID-19 deaths reported by the RKI since Sep 2020 (2020-W35). One complication of this matching is that the RKI deaths are reported by the week that the information about the death reached the RKI and not the week of death. In order to match it with the Destatis all-cause mortality time series, we extrapolate week of death from the week of report by the simple assumption that the death occurred 2 weeks before the report2.
Furthermore, to avoid a downward bias in the observed numbers by observed-but-not-yet-reported deaths, the previously shown Destatis analyses of all-cause mortality does not include the most recent weeks, where COVID-19 associated mortality increased substantially in Germany: the analysis is only done until 2020-W47, even though the date of analysis was 2020-12-18. At this time the RKI in their situational report of 2020-12-22 already reported a total of 26964 COVID-19 associated deaths - only 15686 have their time of death up to 2020-W47. We thus expect the reported excess mortality to increase within the coming weeks. As a simple extrapolation, we assume that all COVID-19 associated mortality in the subsequent weeks above the level in 2020-W47, is directly summable to the 2020 all-cause mortality3. With this simple extrapolation, the excess mortality computations can be extended until 2020-W50 and leads to the following predictions:
We note that the COVID-19 associated deaths in the most recent weeks in the 80+ age groups make up more than 30% of all deaths reported on average over the years 2016-2019. This would mean an excess of mortality for the period of 2020-W01 to 2020-W50 of 5%, which is likely to increase even further as the remaining weeks of 2020 are added4.
Discussion
Considering all-cause mortality and COVID-19 associated mortality as a measure for the impact of an pandemic is a rather simplistic view of the pandemic. COVID-19 infections can be very mild, but complicated progressions can occur without leading to death (see, e.g., long COVID). Looking at mortality also ignores the complex interplay between age-groups, where it can be beneficial to reduce infections in a not-so-affected-by-the-disease age-group in order to protect the higher-risk groups. The motivation of this post was primarily to put COVID-19 associated mortality in relation to all-cause mortality in order to get a better understanding of the daily number of COVID-19 deaths. An age-stratified view is necessary for this.
We showed that the Destatis reported excess-mortality are expected to increase in the coming weeks. The extrapolations used in the present analysis are simplistic and could be improved by a nowcasting approach, which extrapolates not-yet-reported deaths from knowledge about the reporting delay (Schneble et al. 2020). For a more modelling based analysis of the German COVID-19 associated mortality data see also the work by Linden et al. (2020) (updated analysis). More information on real-time mortality monitoring can be obtained from the EuroMoMo methodology page or Höhle and Mazick (2010). Comments and feedback to the analysis in this blog post are much appretiated.
Update 2020-03-01: An up-to-date version of this post, including an analysis of the most recent Destatis and RKI data is available here.
Literature
More involved ways to compute excess-mortality are imaginable.↩︎
Using two weeks provided the best fit to the unstratified number of observed cases by week of death. More advanced transformation schemes than simply subtracting two week are imaginable.↩︎
Note: This is really a guesstimate and might produce a slight excess, because some of the individuals who would have died in this week in a COVID-free year, by chance now happen to die this week with COVID-19. However, part of inferential statistics is to make predictions (which can be wrong) in timely fashion. If you want the true numbers, you will have to wait to end of Jan 2021 or even to mid-2021 (when the official mortality statistics is released). This is not helpful for situational awareness during a pandemic.↩︎
Note that 2020 has an ISO week 53 spanning 2020-12-28 to 2021-01-03, whereas none of years 2016-2019 had an ISO week 53. It will be interesting to see how this week will be handled by Destatis for the excess mortality calculations.↩︎