Naming Uncertainty: Ranks and Collisions
This page contains additional material for the article
Höhle, M. (2017), Rank uncertainty: Why the “most popular” baby
names might not be the most popular. Significance, 14:
30–33. doi:10.1111/j.1740-9713.2017.01037.x
Pre-Print Version of the Article
Data
- Baby
Names Statistics by the Office for National Statistics
(ONS), which contains the frequency of all names occurring more
than 2 times in a given year.
- 2015 Data used for the article:
Boys (2015) | Girls
(2015)
- Additional information for the 2015 data provided by the ONS
customer service:
- Boys:
Number of names that occurred twice in 2015: 3,050
Number of names that occurred once in 2015: 18,741
- Girls:
Number of names that occurred twice in 2015: 3,999
Number of names that occurred once in 2015: 23,733
- In 2016 the number of names occurring only once or twice per
gender are now directly included as Table 1 of the ONS
Bulletin
- Alternatively one can find the ONS data without the additional
information in the R package ukbabynames.
Software and Computations
- Github project naming
containing
- the R code of the ONS data pre-processing (automatic
downloading, data loading and formatting)
- knitr::purl output of the Rmarkdown code generating the
article. This includes code to generate all the numbers of the
article
- HTML
output of running the R part of the Rmarkdown code
- code for the creation of the bonus material below
- R-package birthdayproblem,
which allows one to solve the birthday problem with unequal
occurrence probabilities
Background
Bonus Material
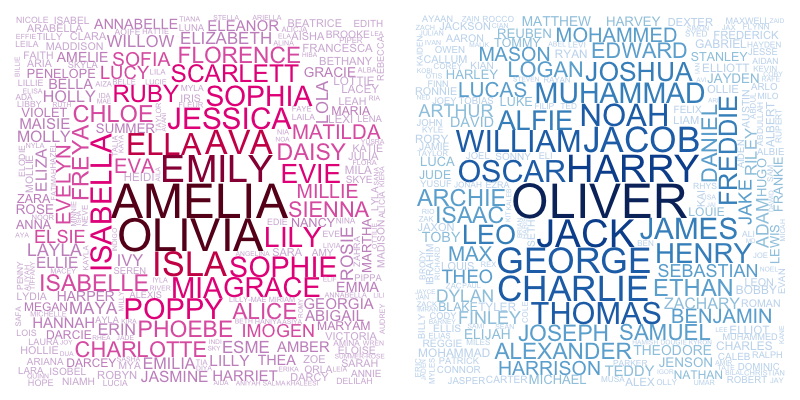
Instead of by tables the frequencies of the 2015 baby names can
also be visualized using word clouds. The size of the name
is proportional to the number of births in 2015.
Based on the ONS
Baby Names Statistics data available for the years 1996-2016
containing all names in a given year occurring more than twice, we
can compute the yearly collision probability. Note: The computed
probability will be an upper limit to the actual collision
probability, because no statistics is available for names
occurring once or twice. However, for 2015 this information was
obtained from the ONS (see above), upon request the ONS in 2016
incorporated this information directly into their bulletin. As a
consequence, we can compute the correct collision probability for
2015-2016 as done in the article. The obtained time series
plot can be compared to similar plots for the US
1880-2014 as well as Sweden
1998-2016.
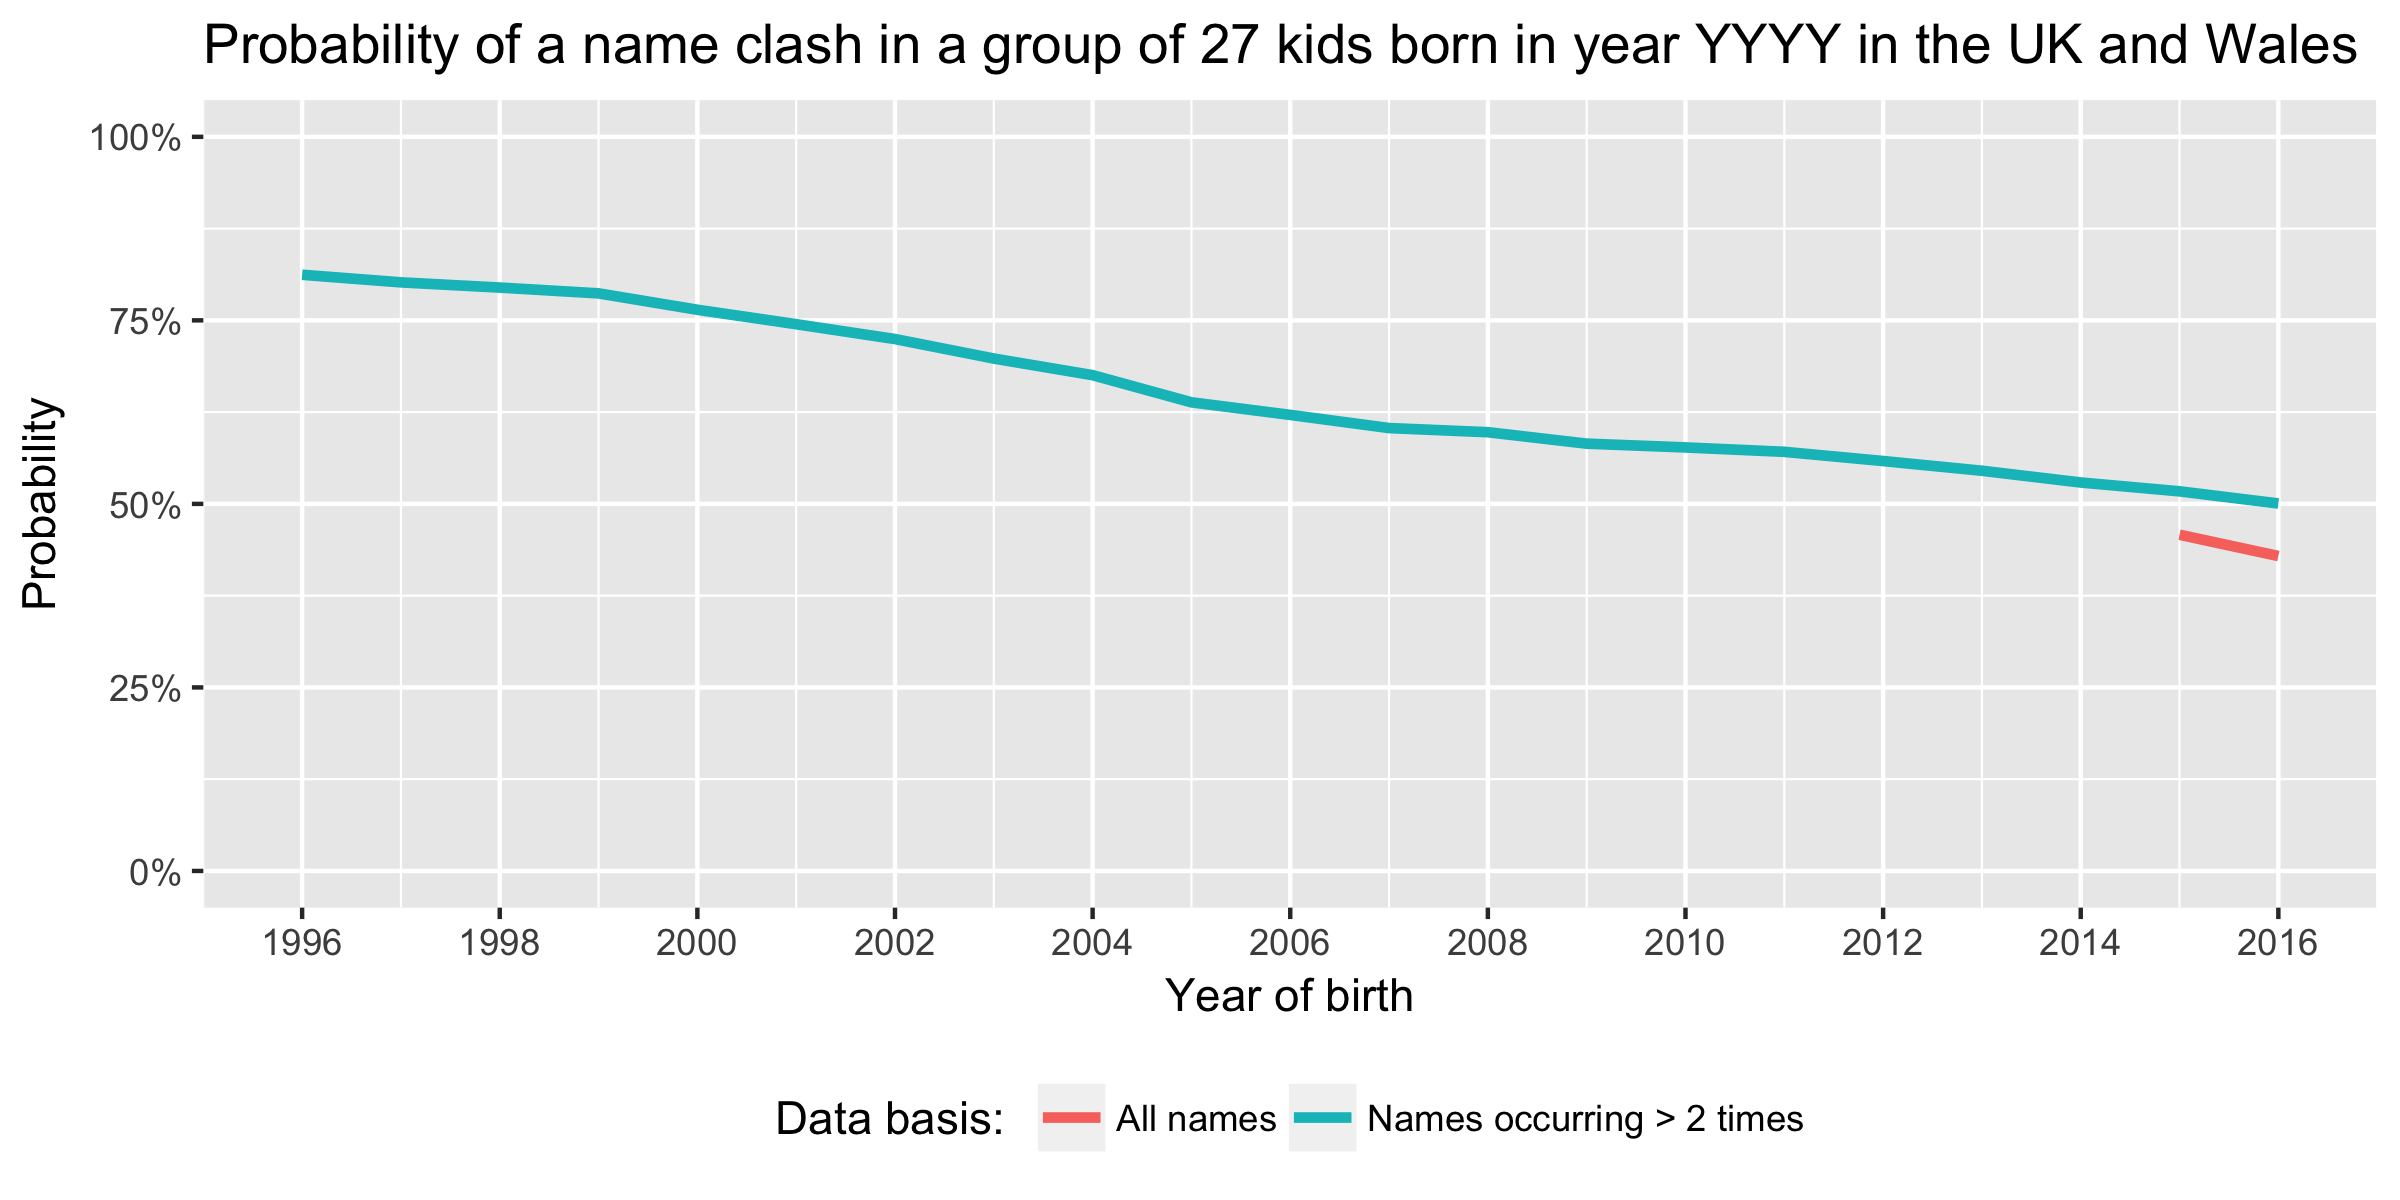
Figure: Collision probability for the cohorts
born 1996-2016 based on the baby names datasets containing all
names with more than two uses in a given year. The orangish line
in the figure indicates the collision probability for 2015-2016
computed on all names, i.e. also those including those names
occurring just once or twice in a given year.