On a First Name Basis with Statistics Sweden
Abstract
Judging from recent R-Bloggers posts, it appears that many data scientists are concerned with scraping data from various media sources (Wikipedia, twitter, etc.). However, one should be aware that well structured and high quality datasets are available through state’s and country’s bureau of statistics. Increasingly these are offered to the public through direct database access, e.g., using a REST like API. We illustrate the usefulness of such an approach by accessing data from Statistics Sweden.
 This work is licensed under a Creative Commons
Attribution-ShareAlike 4.0 International License. The
markdown+Rknitr source code of this blog is available under a GNU General Public
License (GPL v3) license from github.
This work is licensed under a Creative Commons
Attribution-ShareAlike 4.0 International License. The
markdown+Rknitr source code of this blog is available under a GNU General Public
License (GPL v3) license from github.
Introduction
Scandinavian countries are world-class when it comes to public
registries. So when in need for reliable population data, this is the
place to look. As an example, we access Statistics Sweden data by their
API using the pxweb package developed by @MansMeg, @antagomir and @LCHansson. Love was the first
speaker at a Stockholm R-Meetup some years
ago, where I also gave a talk. Funny how such R-Meetups become
useful many years after!
library(pxweb)By browsing the Statistics Sweden (in Swedish: Statistiska Centralbyrån (SCB)) data using their web interface one sees that they have two relevant first name datasets: one containing the tilltalsnamn of newborns for each year during 1998-2016 and one for the years 2004-2016. Note: A tilltalsnamn in Sweden is the first name (of several possible first names) by which a person is usually addressed. About 2/3 of the persons in the Swedish name registry indicate which of their first names is their tilltalsnamn. For the remaining persons it is automatically implied that their tilltalsnamn is the first of the first names. Also note: For reasons of data protection the 1998-2016 dataset contains only first names used 10 or more times in a given year, the 2004-2016 dataset contains only first names used 2 or more times in a given year.
Downloading such data through the SCB web-interface is cumbersome,
because the downloads are limited to 50,000 data cells per query. Hence,
one has to do several manual queries to get hold of the relevant data.
This is where their API
becomes a real time-saver. Instead of trying to fiddle with the API
directly using rjson or RJSONIO we use the
specially designed pxweb package to fetch the data. One can
either use the web-interface to determine the name of the desired data
matrix to query or navigate directly through the api using
pxweb:
d <- interactive_pxweb(api = "api.scb.se", version = "v1", lang = "en")and select Population followed by Name statistics
and then BE0001T04Ar or BE0001T04BAr,
respectively, in order to obtain the relevant data and api download
url.
Downloading the
first name data with pxweb
This leads to the following R code for download:
names10 <- get_pxweb_data(
  url = "http://api.scb.se/OV0104/v1/doris/en/ssd/BE/BE0001/BE0001T04Ar",
  dims = list(Tilltalsnamn = c('*'),
              ContentsCode = c('BE0001AH'),
              Tid = c('*')),
  clean = TRUE) %>% as.tbl
For better usability we rename the columns a little and replace
NA counts to be zero. For visualization we pick 5 random
lines of the dataset.
names10 <- names10 %>% select(-observations) %>%
  rename(firstname=`first name normally used`,counts=values) %>%
  mutate(counts = ifelse(is.na(counts),0,counts))
##Look at 5 random lines
names10 %>% slice(sample(seq_len(nrow(names10)),size=5))
## # A tibble: 5 × 3
## firstname year counts
## <fctr> <fctr> <dbl>
## 1 Livia 1998 0
## 2 Elicia 2010 21
## 3 Amie 2000 0
## 4 Albert 2011 108
## 5 Kim 2008 14Note: Each spelling variant of a name in the data is treated as a
unique name. In similar fashion we download the BE0001AL
dataset as names2.
Imputing first names with only one use
Since the names2 dataset contains all first names with 2
or more uses in a given year it is possible to deduce how many first
names are used only once by subtracting the total number of names in
names2 from the total number of live births per year.
##Total number of newborns in the data per year
names2_year <- names2 %>% group_by(year) %>% summarise(names=sum(counts))

##Fetch number of live births per year from the corresponding data set
births <- get_pxweb_data(
  url = "http://api.scb.se/OV0104/v1/doris/en/ssd/BE/BE0101/BE0101H/FoddaK",
  dims = list(Region = c('00'),
              AlderModer = c('tot'),
              Kon = c('*'),
              ContentsCode = c('BE0101E2'),
              Tid = c('*')), clean = TRUE)
##Aggregate per year
births_year <- births %>% group_by(year) %>% summarise(births=sum(values))

##Join and compute difference, which is the number of names used exactly once.
(names_join <- inner_join(names2_year, births_year, by="year") %>%
  mutate(nNames1=births-names, propNames1=nNames1/births))
## # A tibble: 13 × 5
## year names births nNames1 propNames1
## <chr> <dbl> <dbl> <dbl> <dbl>
## 1 2004 99958 100928 970 0.009610812
## 2 2005 98718 101346 2628 0.025930969
## 3 2006 101944 105913 3969 0.037474153
## 4 2007 101262 107421 6159 0.057335158
## 5 2008 101356 109301 7945 0.072689179
## 6 2009 102989 111801 8812 0.078818615
## 7 2010 108405 115641 7236 0.062572963
## 8 2011 103480 111770 8290 0.074170171
## 9 2012 104448 113177 8729 0.077126978
## 10 2013 104465 113593 9128 0.080357064
## 11 2014 106021 114907 8886 0.077332103
## 12 2015 105012 114870 9858 0.085818752
## 13 2016 107536 117425 9889 0.084215457We notice that the proportion of names occurring exactly once increases substantially over the years - going from 1.0% in 2004 to 8.4% in 2016. It’s not clear if the imputation by subtraction is 100% exact, but it does sound plausible that names have become more unique.
Merging it all
Based on the above we can create a data.frame containing
the correct number of names used once.
missing1names <- names_join %>% group_by(year) %>% do({
  data.frame(firstname=paste0("Uniquename",.$year,"-",sprintf("%.5d",seq_len(.$nNames1))),year=.$year,counts=1L)
}) %>% ungroup
We now join the three datasets into one large data.frame
by
names <- rbind(data.frame(names10,type="min10"),
               data.frame(names2,type="min02"),
               data.frame(rbind(names2,missing1names),type="min01")) %>% as.tbl
Collision probabilities
We thus got everything in place to compute the name collision
probability over time using the birthdayproblem package (as
shown in previous
posts).
library(birthdayproblem)
collision <- names %>% group_by(year,type) %>% do({
data.frame(p=pbirthday_up(n=26L, prob= .$counts / sum(.$counts),method="mase1992")$prob, gini= ineq::Gini(.$counts))
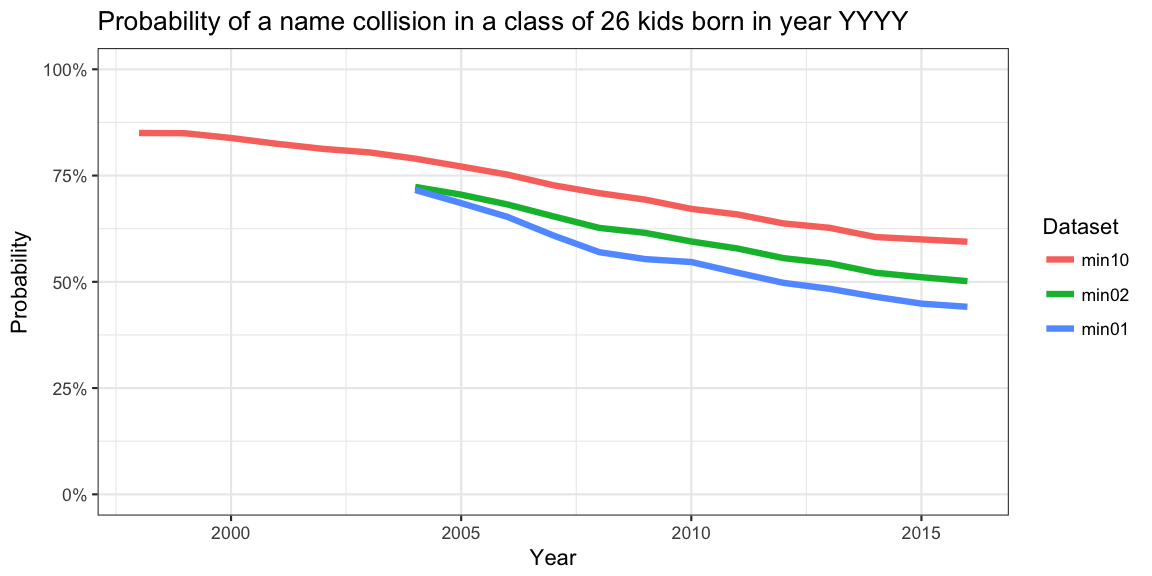
}) %>% ungroup %>% mutate(year=as.numeric(as.character(year)))And the resulting probabilities based on the three datasets
min02 (at least two instances of the name in a given year),
min10 (at least ten instances of the name in a given year)
and the complete dataset min01 can easily be visualized
over time.
ggplot( collision, aes(x=year, y=p, color=type)) + geom_line(size=1.5) +
  scale_y_continuous(label=scales::percent,limits=c(0,1)) +
  xlab("Year") + ylab("Probability") +
  ggtitle("Probability of a name collision in a class of 26 kids born in year YYYY") +
  scale_colour_discrete(name = "Dataset")
As seen in similar plots for other countries, there is a decline in
the collision probability over time. Note also that the two curves are
upper limits to the true collision probabilities. The true
probabilities, i.e. taking all tilltalsnamn into account, have been
computed based on the min01 data set, which has been
created by finding the difference between the total number of live
births in a year and the total number of names in
names2.
Summary
With all due respect for the need to anonymise the name statistics, it’s hard to understand why the summary figures of how many names with less than X uses, which have been removed due to privacy concerns, are not automatically reported. This would allow one to immediately compute correct totals and collision probabilities. The same problem occurs, e.g., in the corresponding UK and Wales data. Here, Table 6 is listing all first names with 3 or more uses, but not stating how many newborns have a name occurring once and twice, respectively.
Luckily, the missing number could be obtained for the Swedish data with a bit of data dancing and a simple subtraction. Based on these data the collision probabilities are - opposite to some of my previous blog analyses - exact. Have a look at the SCB data website, maybe the data you are looking for can be found here!