US Baby Name Collisions 1880-2014
Abstract
We use US Social Security Administration data to compute the probability of a name clash in a class of year-YYYY born kids during the years 1880-2014.

 This work is licensed under a Creative Commons
Attribution-ShareAlike 4.0 International License. The
markdown+Rknitr source code of this blog is available under a GNU General Public
License (GPL v3) license from github.
This work is licensed under a Creative Commons
Attribution-ShareAlike 4.0 International License. The
markdown+Rknitr source code of this blog is available under a GNU General Public
License (GPL v3) license from github.
Introduction
After reading a cool post by Kasia Kulma on how the release of
Disney films
have an impact on girl namings in the US, I became aware of the
babynames package by Hadley Wickham. The package wraps the
data by the USA
social security administration on the frequency of all baby names
each year during the period 1880-2014 in the US. Because the data fit
phenomenally in spirit to this blog’s two previous posts on onomastics
and the birthday
problem with unequal probabilities, we use the data to extend our
name analyses in temporal fashion.
library(babynames)
head(babynames,n=2)
## # A tibble: 2 × 5
## year sex name n prop
## <dbl> <chr> <chr> <int> <dbl>
## 1 1880 F Mary 7065 0.07238359
## 2 1880 F Anna 2604 0.02667896Check how many babies and how many unique first names are contained in the data each year:
p1 <- babynames %>% group_by(year) %>% summarise(n=sum(n)) %>% ggplot(aes(x=year, y=n)) + geom_line() + xlab("Time (years)") + ylab("Number of babies")
p2 <- babynames %>% group_by(year) %>% summarise(n=n()) %>% ggplot(aes(x=year, y=n)) + geom_line() + xlab("Time (years)") + ylab("Number of unique names")
gridExtra::grid.arrange(p1, p2, ncol=2)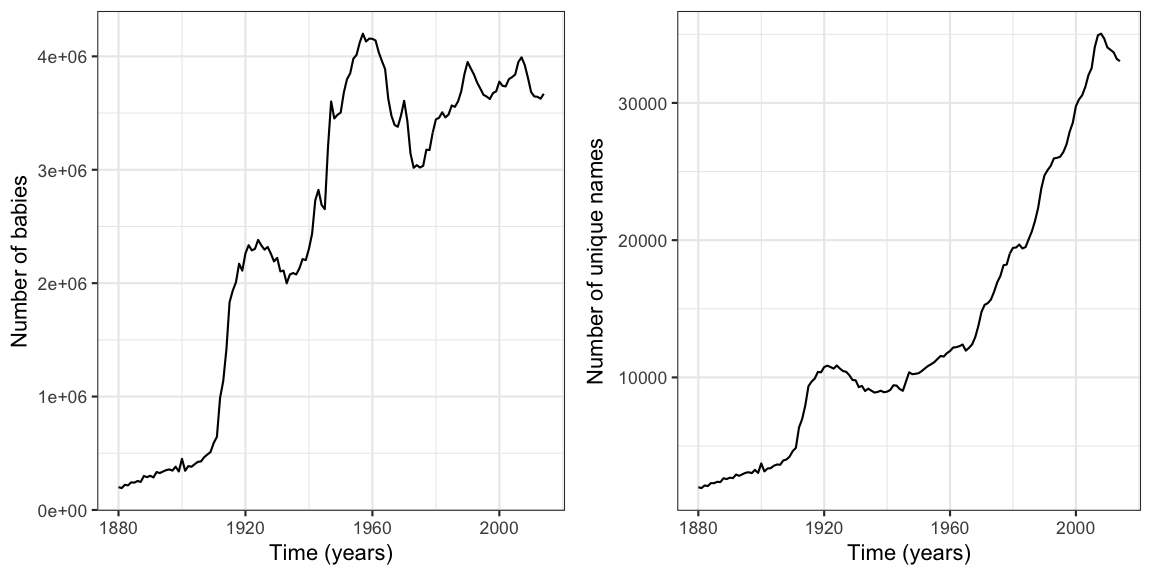
We see that the number of live-births remains at an approximately stable level the last 50 years, whereas the number of unique names kept increasing. Note that for reasons of privacy protection, only names with 5 or more occurrences in a given year, are contained in the data. We therefore investigate the proportion of babies, which apparently have been removed due to privacy protection of the names. This is done by investigating the sum of the proportions column for each year. If all names would be available, the sum per year would be 2 (1 for each gender).
babynames %>% group_by(year) %>% summarise(prop=sum(prop)) %>% ggplot(aes(x=year, y=(2-prop)/2)) + geom_line() + xlab("Time (years)") + ylab("Proportion of the population removed") + scale_y_continuous(labels=scales::percent) It becomes clear that a non-negligible part of the names are removed and
the proportion appears to vary with time. As a simple fix, we re-scale
the yearly proportions per year s.t. they really sum to one.
It becomes clear that a non-negligible part of the names are removed and
the proportion appears to vary with time. As a simple fix, we re-scale
the yearly proportions per year s.t. they really sum to one.
babynames <- babynames %>% group_by(year) %>% mutate(p = n/sum(n))Birthday Problem with Unequal Occurrence Probabilities
The data are perfect for testing the name-collision functionality
from the previous Happy
pbirthday class of 2016 post. Since the writing of the post, the
pbirthday_up function for computing the name collision
probability, which is an instance of the birthday problem with unequal
occurrence probabilities, has been assembled into a preliminary birthdayproblem
R package available from github.
devtools::install_github("hoehleatsu/birthdayproblem")
library(birthdayproblem)
We can now easily calculate for each year the probability that 2 or more kids in a class of \(n\in \{20,25,30\}\) kids all born in a given year YYYY will have same first name:
collision <- babynames %>% group_by(year) %>% do({
  n <- c(20L,25L,30L)
  p <- sapply(n, function(n) pbirthday_up(n=n, .$p ,method="mase1992")$prob)
  data.frame(n=n, p=p)
})
It looks like the name distribution has become more diverse over time, since the collision probability reduces over time. However, some bias is to be expected due to the removal of names with frequencies below 5 in a given year.