suRprise! - Classifying Kinder Eggs by Boosting
Abstract
Carrying the Danish tradition of Juleforsøg to the realm of statistics, we use R to classify the figure content of Kinder Eggs using boosted classification trees for the egg’s weight and possible rattling noises.
 This work is licensed under a Creative Commons
Attribution-ShareAlike 4.0 International License. The
markdown+Rknitr source code of this blog is available under a GNU General Public
License (GPL v3) license from github.
Introduction
A juleforsøg is the kind of exploding experiment happening in the last physics or chemistry class before the Christmas vacation. Not seldomly the teacher, with a look of secrecy, initializes the class by locking the door mumbling something like “the headmaster better not see this…”. With Christmas approaching fast, here is an attempt to create a statistical juleforsøg concluding the Theory meets practice 2016 posting season:
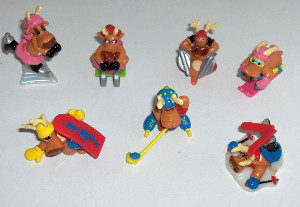
The advertisement campaign of the Kinder Surprise Eggs aka. Kinder Joy claims that the content of every 7th egg is a figure (see example) - otherwise they contain toys or puzzles, which positively can be described as junk. Figures, in particular completed series, on the other hand, can achieve high trading values. The clear goal is thus to optimize your egg hunting strategy in order to maximize figure content.
The problem
Your budget is limited, so the question is which egg to select when standing in the supermarket?
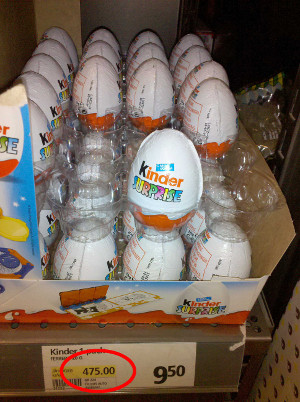
Photo: Price in SEK per egg in a Swedish supermarket. The red ellipse shows the price per kg.
Various egg selection strategies
It goes without saying that brute force purchasing strategies would be insane. Hence, a number of egg selection strategies can be observed in real life:
The no clue egg enthusiast: Selects an egg at random. With a certain probability (determined by the producer and the cleverness of the previous supermarked visitors) the egg contains a figure
The egg junkie: knows a good radiologist
The egg nerd: using scale, rattling noises and the barcode he/she quickly determines whether there is a figure in the egg
We shall in this post be interested in the statistician’s egg selection approach: Egg classification based on weight and rattling noise using ‘top-notch’ machine learning algorithms - in our case based on boosted classification trees.
Data Collection
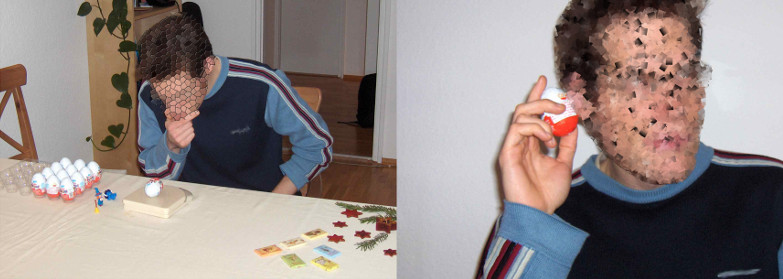
We collected n=79 eggs of which 43.0% were figures - the data are available under a GPL v3.0 license from github. For each egg, we determined its weight as well as the sound it produced when being shaken. If the sounds could be characterized as rattling (aka. clattering) this was indicative of the content consisting of many parts and, hence, unlikely to be a figure.
Altogether, the first couple of rows of the dataset look as follows.
head(surprise, n=5)## weight rattles_like_figure figure rattles rattles_fac figure_fac
## 1 32 1 0 0 no no
## 2 34 0 1 1 yes yes
## 3 34 1 1 0 no yes
## 4 30 1 0 0 no no
## 5 34 1 1 0 no yesDescriptive Data Analysis
The fraction of figures in the dataset was 34/79, which is way higher than the proclaimed 1/7; possibly, because professionals egg collectors were at work…
Of the 79 analysed eggs, 54 were categorized as non-rattling. The probability of such a non-rattling egg really containing a figure was 51.9%. This proportion is not impressive, but could be due to the data collector’s having a different understanding of exactly how the variable rattling was to be interpreted: Does it rattle, or does it rattle like a figure? In hindsight, a clearer definition and communication of this variable would have prevented ambiguity in the collection.
A descriptive plot of the weight distribution of eggs with and without figure content shows, that eggs with figures tend to be slightly heavier:
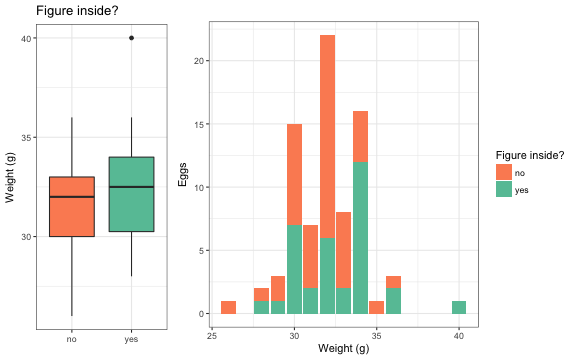 Note: The first approximately 50% of the eggs were weighted on a
standard supermarket scales, which showed the resulting weight in even
steps of 2g only.
Below the proportion (in %) of eggs with figure content per observed weight:
##           weight
## figure_fac    26    28    29    30    31    32    33    34    35    36    40
##        no  100.0  50.0  66.7  53.3  71.4  72.7  75.0  25.0 100.0  33.3   0.0
##        yes   0.0  50.0  33.3  46.7  28.6  27.3  25.0  75.0   0.0  66.7 100.0
A simple selection rule based on weight would be to weigh eggs until you hit a 40g egg. A slightly less certain stopping rule would be to pick 34g eggs. However, modern statistics is more than counting and analysing proportions!
Machine Learning the Egg Content
We use machine learning algorithms to solve the binary classification
problem at hand. In particular, we use the caret package
(Kuhn 2016) and
classify figure content using boosted classification trees as
implemented in the xgboost
package (Chen et al.
2016). Details on how to use the caret package can,
e.g., be found in the following tutorial.
library(caret)

##Grid with xgboost hyperparameters
xgb_hyperparam_grid = expand.grid(
  nrounds = c(25, 50, 100, 250, 1000),
  eta = c(0.01, 0.001, 0.0001),
  max_depth = seq(2,16,by=2),
  subsample = c(0.4,0.5,0.6),
  gamma = 1, colsample_bytree = 0.8, min_child_weight = 1
)
##caret training control object
control <- trainControl(method="repeatedcv", number=8, repeats=8, classProbs=TRUE,
                        summaryFunction = twoClassSummary, allowParallel=TRUE)
##train away and do it parallelized on 3 cores...
library(doMC)
registerDoMC(cores = 3)
m_xgb <- train( figure_fac ~ weight * rattles_fac, data=surprise, method="xgbTree",
               trControl=control, verbose=FALSE, metric="ROC", tuneGrid=xgb_hyperparam_grid)
##look at the result
m_xgb
## eXtreme Gradient Boosting
##
## 79 samples
## 2 predictor
## 2 classes: 'no', 'yes'
##
## No pre-processing
## Resampling: Cross-Validated (8 fold, repeated 8 times)
## Summary of sample sizes: 69, 70, 69, 69, 69, 68, ...
## Resampling results across tuning parameters:
##
## eta max_depth subsample nrounds ROC Sens Spec
## 1e-04 2 0.4 25 0.6661328 0.8661458 0.4328125
## 1e-04 2 0.4 50 0.6657943 0.8661458 0.4359375
## 1e-04 2 0.4 100 0.6760938 0.8661458 0.4398437
## ... ... ...
## 1e-02 16 0.6 250 0.6769792 0.7901042 0.4210937
## 1e-02 16 0.6 1000 0.6578516 0.7364583 0.4335938
##
## Tuning parameter 'gamma' was held constant at a value of 1
## Tuning
## parameter 'colsample_bytree' was held constant at a value of 0.8
## Tuning
## parameter 'min_child_weight' was held constant at a value of 1
## ROC was used to select the optimal model using the largest value.
## The final values used for the model were nrounds = 250, max_depth = 6, eta = 0.01,
## gamma = 1, colsample_bytree = 0.8, min_child_weight = 1 and subsample = 0.4.The average AUC for the 64 resamples is 0.69. Average sensitivity and specificity are 84.0% and 42.1%, respectively. This shows that predicting figure content with the available data is better than simply picking an egg at random, but no figure-guaranteeing strategy appears possible on a per-egg basis.
Predicting the Content of a Particular Egg
Suppose the egg you look at weighs 36g and, when shaken, sounds like a lot of small parts being moved. In other words:
predict(m_xgb, newdata = data.frame(weight=36, rattles_fac="yes"),type="prob")## no yes
## 1 0.4329863 0.5670137Despite the rattling noises, the classifier thinks that it’s slightly more likely that the content is a figure. However, when we opened this particular egg:
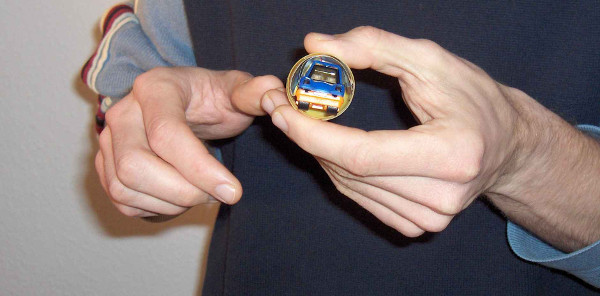
…a car. Definitely not a figure! The proof of concept disappointment was, however, quickly counteracted by the surrounding chocolate…
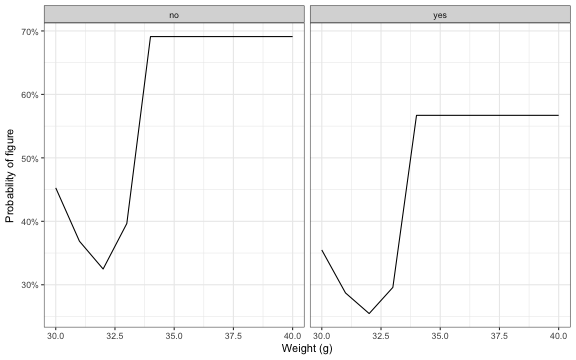
As a standard operating procedure for your optimized future
supermarket hunt, below are shown the classifier’s predicted
probabilities for figure content as a function of egg weight and the
rattles_fac variable.
Discussion
The present post only discusses the optimal selection on a per-egg basis. One could weight & shake several eggs and then select the one with the highest predicted probability for containing a figure. Future research is needed to solve this sequential decision making problem in an optimal way.
Outlook
We have retained a validation sample of 10 eggs and are willing to send an unconsumed 11th element of the sample to whoever obtains the best score on this validation sample. Anyone who knows how to upload this to kaggle?
Acknowledgments
Thanks to former colleagues at the Department of Statistics, University of Munich, as well as numerous statistics students in Munich and Stockholm, for contributing to the data collection. In particular we thank Alexander Jerak for his idea of optimizing figure hunting in a data driven way more than 10 years ago.