4x3 R-Hackathoning - The Finisher's Guide
Abstract
We present experiences from organizing a small R hackathon aimed at advancing knowledge and documentation of the R package surveillance. The hackathon was piggybacked on the ESCAIDE2016 conference visited by current and potential package users in the area of infectious disease epidemiology. The output of the hackathon is available at https://surveillancer.github.io/tutorials/.
 This work is licensed under a Creative Commons
Attribution-ShareAlike 4.0 International License. The
markdown+Rknitr source code of this blog is available under a GNU General Public
License (GPL v3) license from github.
This work is licensed under a Creative Commons
Attribution-ShareAlike 4.0 International License. The
markdown+Rknitr source code of this blog is available under a GNU General Public
License (GPL v3) license from github.
Introduction
A hackathon is a extreme-programming sprint-like event where people involved in software development (and beyond) meet for a short period of time with the purpose of collaborative programming, typically in the context of open-source software. The word hackathon is a merger of hack and marathon, where hacking is to be understood as the skillful modification of computer programs (and not the malicious circumvention of security measures). Lots of good guides have been written on how to run a successful Hackathon. In the area of infectious disease epidemiology, which has been the main area of motivation for our statistical developments and implementations, very successful events (hackout, hackout2, hackout3) have previously been organized. At a much smaller scale we wanted to ignite the energy and enthusiasm such an event spawns.
As a consequence, this blog post gathers our experiences from organising a small 4x3 hackathon (4 people, 3 days) for the surveillance R-package in connection with the ESCAIDE2016 conference in November 2016. Our hope is that these experiences might be useful for others - even if working in very different contexts.
Organizing and Running the Hackathon
We report on a number of practical “?” and “!” below.
Why?
Over the last several years we worked on a package for the visualization, modelling and monitoring of surveillance time series. As most of us are busy with other tasks now, it felt like a good idea to all meet in person to work a little on the package and network with potential users in order to increase awareness of the package. The 10’th European Scientific Conference on Applied Infectious Disease Epidemiology (ESCAIDE2016) organized by the European Centre for Disease Prevention and Control (ECDC) in Stockholm, Sweden, 28-30 Nov 2016, with its about 600 participants, felt like the right place to be.
A Cool Name?
Stockholm is placed on the 59th parallel north, hence, during end of November daylight is limited to approximately 6:30 hours. In other words: Perfect hacking conditions. In order to honour this, Hack in the Dark became our internal handle for the hackathon.
Who?
Hackathons come in all sizes. We decided on a mini four person hackathon of experienced R users, who all knew the package well: two former Ph.D. students who had used the package as the implementational repository for their methodological developments (one of them now being the package maintainer), a former power-user of the package and the package creator. Alternatively, we could have involved new persons in order to expand awareness of the package and increase diversity of the hackathonians, but we decided to go for the small team in order to maximize efficiency.
Venue?
Piggybacking on an existing conference held in a large conference centre meant we did not have to worry about WLAN, food and seating. Especially when only being 4 persons.
What to do?
We started about 8 weeks before the hackathon to brainstorm using slack as a messaging system. We then created a priority matrix in google docs allowing each of the participants to prioritize the ideas. This gave us an initial idea of what we wanted to do. Unfortunately, most of us then got pretty busy with other activities so we never managed to revisit the matrix until a couple of days before the start of the hackathon. Instead, we recapitulated matters in an “indian buffet process” meeting in Stockholm at the night before the hackathon:
- Write i/o tutorials explaining how to get data into the package and then use package functions for cool visualizations of the data
- Use open European data for the tutorials - the theme of ESCAIDE2016 was after all: Data for action
- Make a shiny app to visualize the effect of various parameters choices for the surveillance algorithms implemented in the package. The best choice of configuration has been a recurrent user question throughout the years.
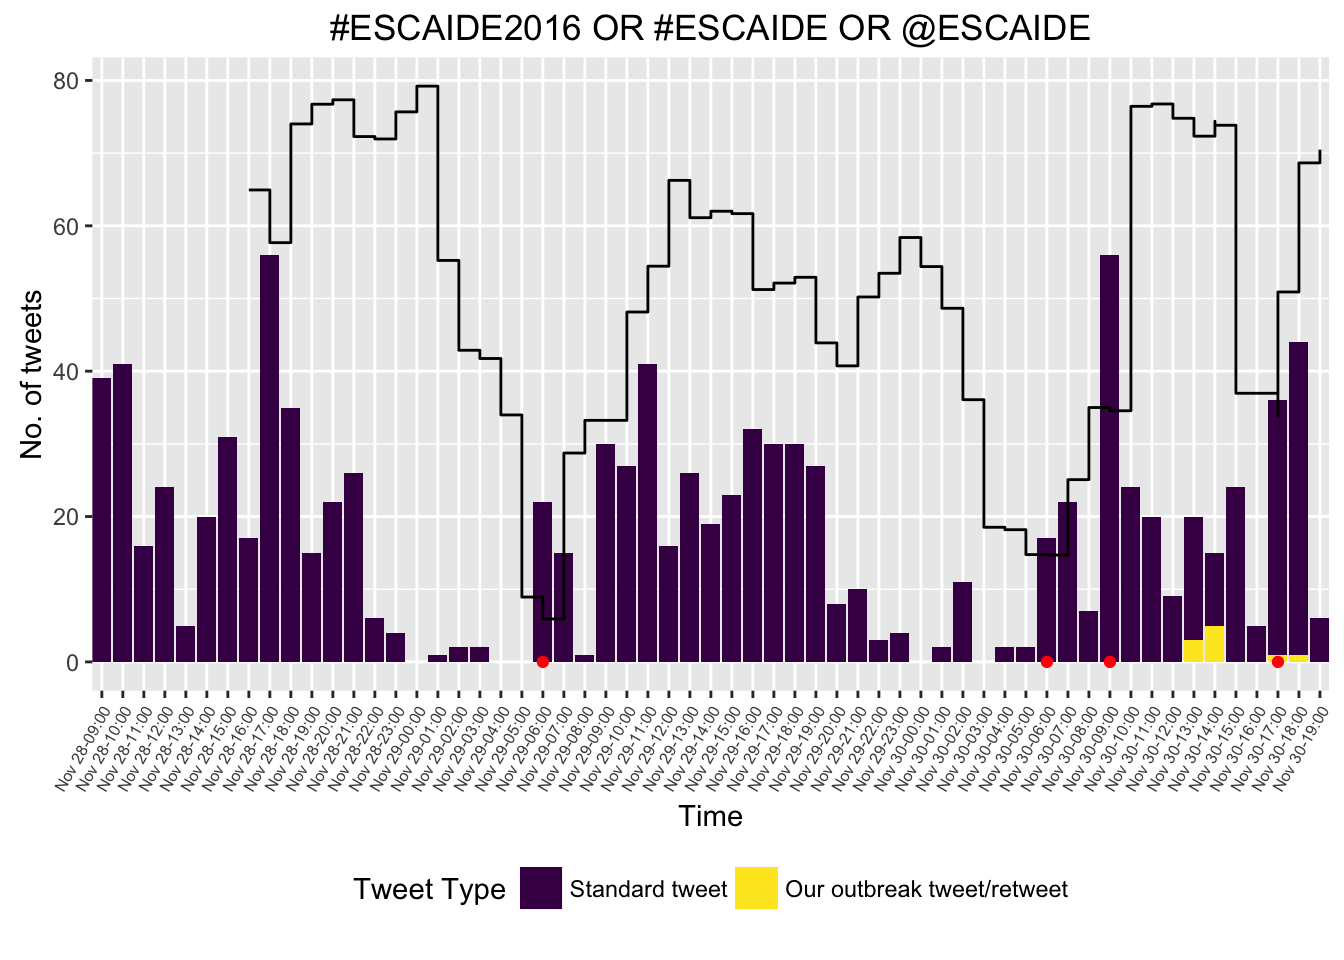
- Demo twitter surveillance by monitoring the conference hashtag
#ESCAIDE2016.
Source Code Management?
We chose to create an organization surveillancer on
github, which we then all joined
with our individual github accounts. All new projects were then
conducted by initiating new repositories. The surveillance
package itself is still developed on R-Forge using
svn, but since we knew most of our work would be
using the surveillance package rather than developing
the package, we decided to keep the existing infrastructure for the
package and instead develop the planned tutorials and visualizations in
a new github project. This worked ok, but switching between
svn and git for commits on different projects
was not always helpful: git commit -a is a useful friend if
you don’t know the git
staging area…
Project Output Format?
We decided to create an R package and then use Hadley Wickham’s new pkgdown package to create a website containing all hackathon output. The above specified tutorials were then created as vignettes. An immediate advantage of this approach was that all hackathon output was bundled and that vignette code was directly available for the interested user.
Demo, demo, demo!
Inspired by the extreme programming paradigm, and because we wanted to interact with the conference, we decided to demo at least once a day by posting hackathon output on twitter. Besides the outgoing publicity we also frequently demo’ed internally in order to get input and suggestions. This worked pretty well - there is nothing as motivating and interactive as getting constructive input and suggestions from your table neighbour!
Interaction with the other conference participants, on the other hand, was moderate. We showed parts and pieces to interested people, but in hindsight we should have aimed for a poster presentation or a related activity in order to generate more real-life awareness of the hackathon outside the virtual world of twitter.
Summing Up
The three days of hackathon passed quickly, but we managed to get the four formulated outputs done.
Intense software sprints are hard work, thus, it was natural that towards the end of the hackathon the concentration decreased slightly. However, phases of intense coding are perfectly supplemented by listening to scientific talks, talking to former colleagues visting the conference or sharing the passion of R with others working in the field. In particular it was nice to exchange ideas with Thibaut Jombart, whose R Epidemics Consortium (RECON) project hopefully is able to bundle the R initiatives in infectious disease epidemiology a little. Besides the availability of software, the training aspect of new users (e.g. trainee epidemiologists) is also crucial. Finally, the aftermath of the hackathon is as important as the pre-event planning: dedicated coordinators have to ensure that loose ends are wrapped up. Here, the participants’ enthusiasm declines quickly as other activities become higher priorities. Again, it’s essential to have a clear goal of what needs to be done (e.g. a blog entry…).
Altogether, code sessions such as a reproducibility session or a toolbox session could be components for spicing up scientific conferences. For example the toolbox event could consist of a set of interested people, who on conference day 1 decide to implement a particular method useful in practice, and then demo it on the last day. Obviously, all these suggestions take time away from other conference content and certainly are more stressful than dozing of in the plenary sessions…
No matter what, focus of a hackathon should also be on social aspects. It also proves wise not to ignore fresh air & sunlight completely. To our surprise, the 6:30 hours of daylight were at times actually quite sunny in Stockholm!
Visit the Hack in the Dark Output
The output of the hackathon can be found here:
In order to run the accompanying code (available from github by
clicking on the “fork me on github” icons), version 1.13.0 of the
surveillance package is needed (available from CRAN). As an
appetizer to check out the hackathon site or the code, here are two
of our tweets demoing output during the event:
First draft output of the #ESCAIDE2016 surveillance #rstats hackathon: Visualizing #opendata by (ECDC_EU?) on Salmonella Agona. #data4action pic.twitter.com/8ApaDNF07L
— Michael Höhle (@m_hoehle) November 28, 2016
Interactive illustration of monitoring algorithms for infectious disease surveillance #escaide2016 #rstats https://t.co/qizcqqMbEJ pic.twitter.com/LyZujDLsF2
— Dirk Schumacher (@dirk_sch) November 29, 2016
The Future
We wish you all the best for your own hackathon event. Put software on the scientific agenda!
Acknowledgments
Thanks to Maëlle Salmon, Dirk Schumacher and Sebastian Meyer for all their great work and the creative atmosphere during the hackathon! The event was implicitly supported by the Swedish Research Council as part of the project Statistical Modelling, Monitoring and Predictive Analytics against Infectious Disease Outbreaks (grant number 2015-05182_VR).